It has been a while since I posted something technical so here goes. This article is meant for someone who has done PHP development before, and already has a web server and a working PHP installation.
Traditionally in the old days these are the things that I do to debug my PHP code:
- Put in extra echo statements that print variable values. It’s easy to miss them when actually deploying the code to production
- Use “here I am” echo statements to identify positions in the script. These are also easy to miss
- Modify php.ini to verbosely display every error or warning messages. While this is not a concern on development boxes, it might be a problem on production servers
- Using custom self-made loggers or something from PEAR or PHPClasses to have a log file written for debugging purpose. This method takes a toll on the time required to actually go through the log which might contain lots and lots of information
A commercial alternative to Xdebug is Zend Studio Web Debugger. Zend’s solution is quite a bit on the pricy side but it’s also supported out of the box by PDT.
Prerequisites
- PHP installation. I use XAMPP since it’s clean and it’s quick to set up. If you like to live on the bleeding edge with all the latest updates you can install PHP properly in your system either by using the installer or the zip package
- Eclipse installation. I use Aptana Studio
- Web server application such as Apache or IIS. I use Apache.
- PDT (PHP Development Tools) as a plugin for Eclipse/Aptana.
The debugger
The procedure to configure the debugger is not that different between Zend Studio Web Debugger or Xdebug. I am going to make an example of using Xdebug here.
While Windows users are able to download Xdebug binary and use it immediately, *NIX users have to compile it. Luckily I found that ASPN provides binaries to use with their Komodo IDE (yes, I am lazy to setup binutils and compilers). The zip file contains extension for PHP 4.4-5.3 (at the moment this article was written).
- Download Xdebug binary from the ASPN site mentioned above. Extract it to a temporary folder and choose the version corresponding to your PHP version. (Hint: to find your PHP version you can create a PHP file containing
< ?php phpinfo(); ?>and view it through your web server) - Copy xdebug.so to the extensions folder. You can also find out where is your extension folder by looking at the phpinfo output, under header “Core” and Directive “extension_dir”.
- Edit php.ini (or create an .ini file in php.d depending on your configuration) to include the following:
[xdebug]
zend_extension="/full/path/to/your/extension/dir/as/shown/in/phpinfo/xdebug.so"
- Restart your web server and you should be able to see xdebug listed in the phpinfo output
*Note: As you might have realized by now, phpinfo(); can be your best friend. It can also be your worst enemy if you put it in a production server, with a super simple name like phpinfo.php as it contains a lot of sensitive information about the server.
Configuring PDT
There are 3 main settings to focus on, to enable debugging in PDT.
1. PHP Executables
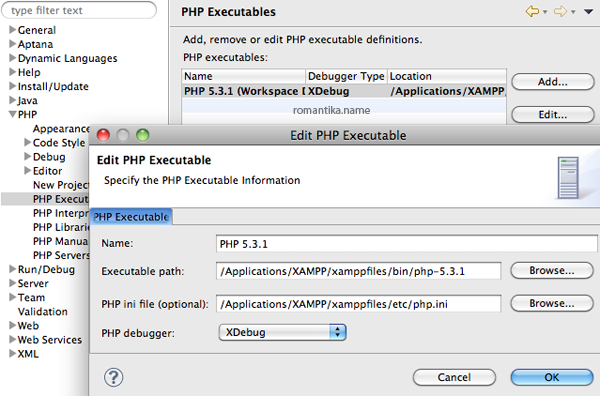
As I mentioned earlier, I am using XAMPP. As long you point this to the working PHP installation corresponding to where you install Xdebug, you’ll be fine.
2. PHP Server & Path Mapping
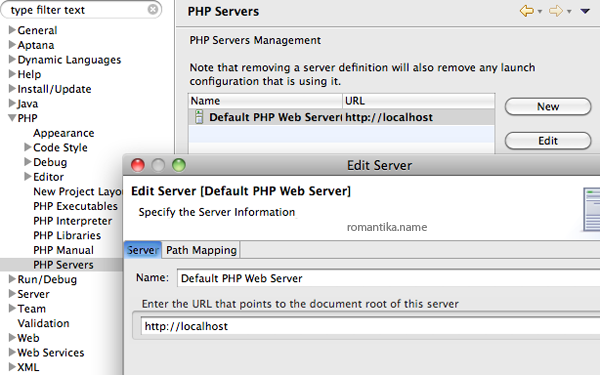
This is where you specify your web server.
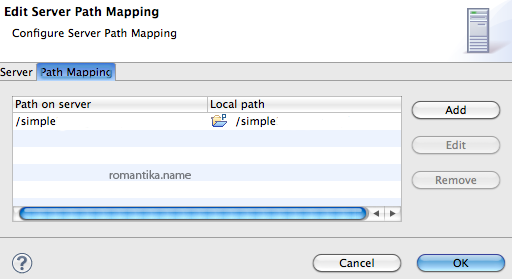
Mapping is used to tell the debugger the path of the files accessible via the web server and the corresponding path in your workspace.
3. PHP Debug
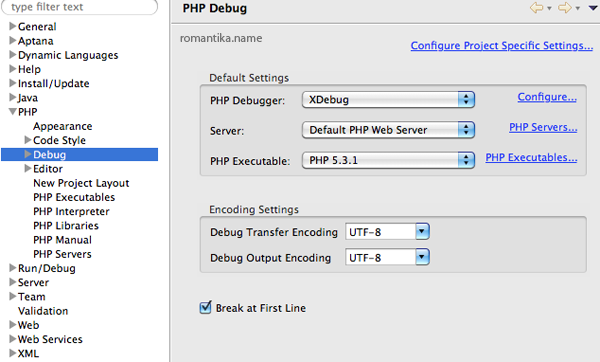
The options are self-explanatory. You’ll have to select the Server and Executable that you have configured. The default port for Xdebug is 9000 so if you decide to change your Xdebug port remember to change it here too.
Conclusion
Debugging using an IDE is a great way to save time, and to step into your application. If you have done everything correctly, you may use Eclipse/Aptana to debug your PHP files now (Menu > Run > Debug > Run as…) and you’ll get prompted to switch to the PHP Debug Perspective.
Good luck!


